Some weeks you run out of product. Other weeks you are stuck with too much of it. Those two situations seem opposite, but they come from the same root: you are deciding when to restock inventory without reading what your sales are already telling you.
The answer is already inside your store. You do not need an ERP or a complicated spreadsheet. You just need to learn how to read three simple signals that your store's sales data is already giving you today.
Why "gut-based" restocking squeezes your cash flow
Most small retailers react to the shelf. If something is gone, they order more. If something is left over, they stop ordering. By the time you are reacting to the shelf, your store has already lost.
It loses one way or another. If you ran out, the customer asked for it on WhatsApp, you checked the counter, and it was not there, the sale walked away. If you overbought, the money tied up in that product never became the next order.
That math builds up quietly. One lost sale here, one slow-moving product there, and by the end of the month your cash gets tight for reasons that are hard to see.
The store owner who starts reading sales data to decide restocking replaces guesswork with three basic questions:
- How long will my current inventory last?
- Is any product selling faster than normal?
- Which products are actually carrying my store?
You probably already have answers to all three. You just have not stopped to read them.

Signal 1: How many days your current inventory will last
The first signal is the most urgent one. It is the one that prevents stockouts, and it is also the easiest to calculate.
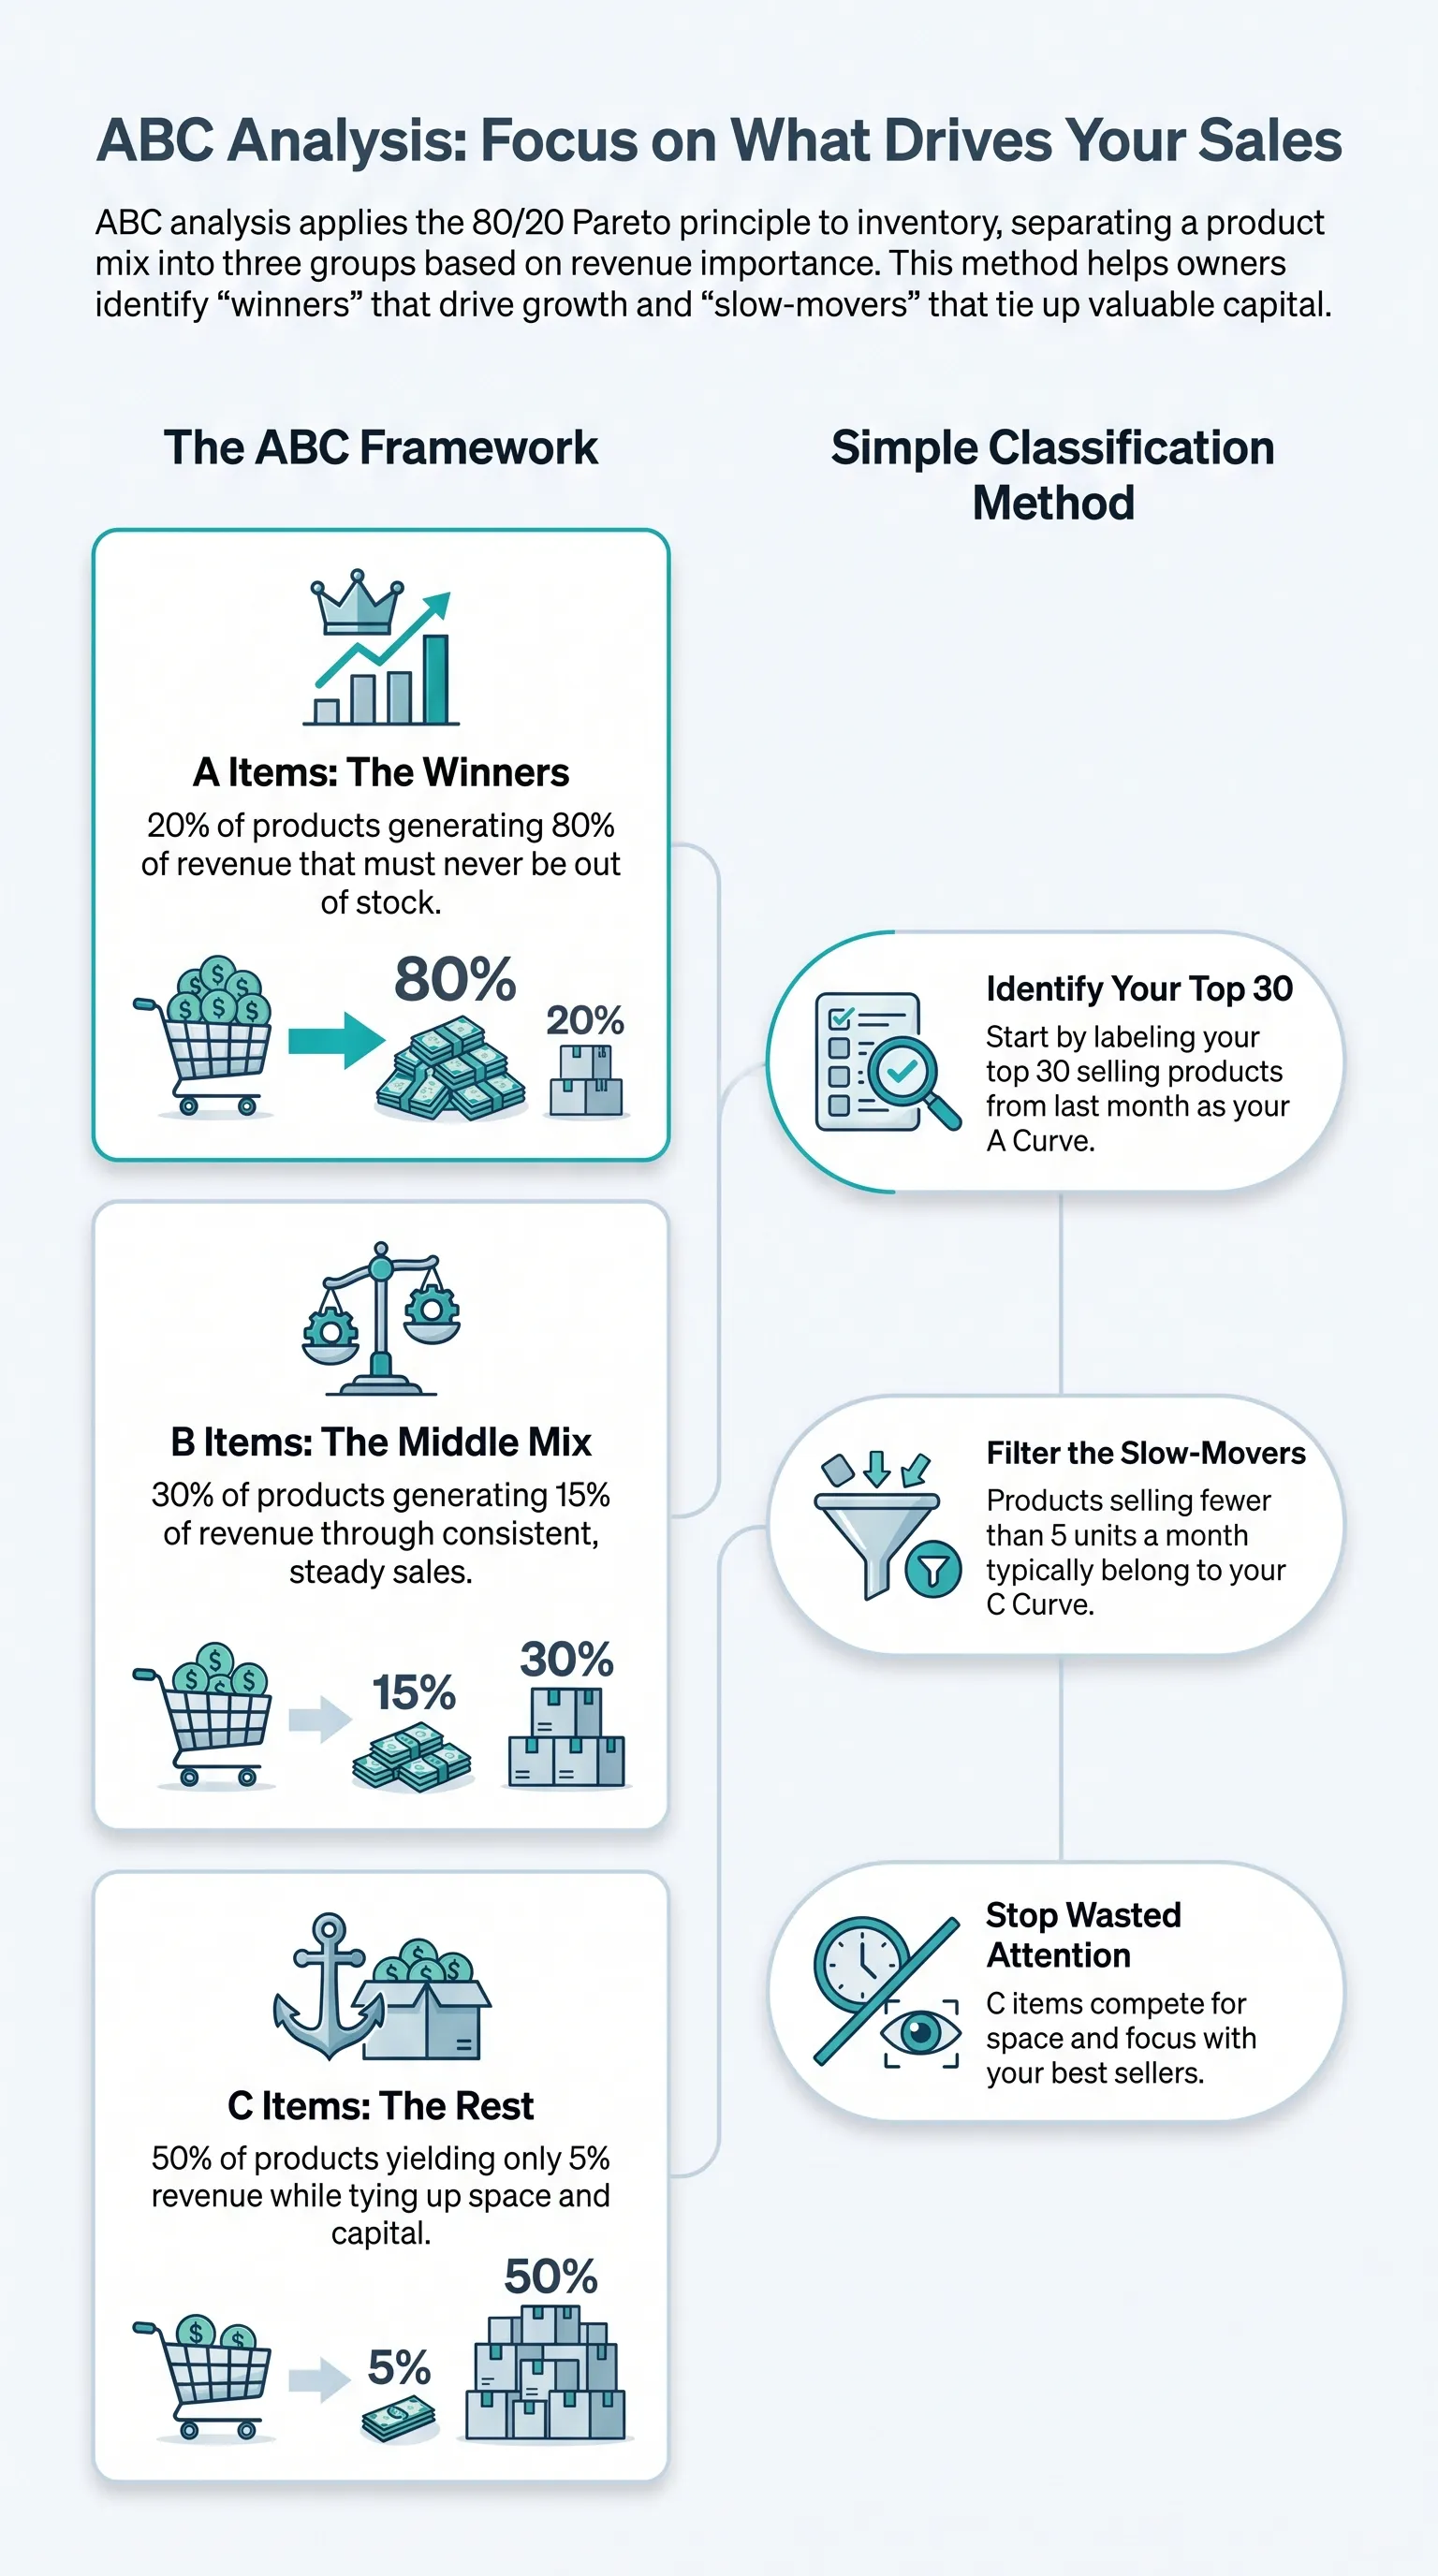
The math fits in one sentence: how many units you have in inventory divided by how many units you sell per week. The result tells you how many weeks your current inventory will last.
Practical example: you have 45 units of a product. You sell an average of 10 per week. Your coverage is 4.5 weeks. When that coverage drops to 2 weeks or less, it is time to order more. Not earlier, so you do not lock up capital. Not later, so you do not end up chasing the stockout.
That number is called inventory coverage. It is the most direct indicator there is for short-term restocking decisions. The advantage is that it does not depend on ERP software or a complex spreadsheet. You are just dividing one number by another that you already know.
When this signal is clearly saying "restock now"
The practical rule is this:
- Below 2 weeks of coverage, restock.
- Above 4 weeks, wait.
- Between 2 and 4 weeks, start preparing the order with your supplier.
That 2-week window is what gives your supplier time to deliver without leaving you with an empty shelf. If your supplier takes 10 days, for example, placing the order when coverage reaches 2 weeks gives the product time to arrive before you run out.
And one important detail: coverage is not the same thing as minimum stock. Minimum stock is the limit you defined, like "never go below 10 units." Coverage is a dynamic number, calculated based on how fast the product is selling. When sales speed up, coverage shrinks faster, even if you have not hit your minimum stock threshold yet.
Your sales records show your sales speed by product, which is the main input for calculating inventory coverage. And when the decision is "order now" or "wait," supplier management helps make sure the order gets there on time.
What this signal cannot tell you on its own
Coverage is excellent for preventing short-term stockouts, but it does not tell you everything. A product with 4 weeks of coverage may be selling so poorly that you are tying up capital for no reason. Another product may be accelerating, and its current coverage may not survive the spike that is coming.
To answer those questions, you need the second signal.

Signal 2: A product is selling faster than usual
The second signal is about getting ahead of the problem. Instead of chasing the stockout, you start seeing the spike before it happens.
There are two types of acceleration. The first one is obvious: you know it is coming. The second one is hidden, and that is where most store owners lose money without realizing it.
Obvious seasonality: dates, heat, cold
Seasonal spikes are predictable if you know where to look. Back-to-school products jump at certain times of year. Beauty products rise around big gift-buying dates. Swimwear moves faster when hot weather starts. Every segment carries its own calendar, and it is worth looking at last year's history before planning this year's restocking.
If you have been in retail for more than a year, those spikes are already in your historical data. And one detail matters a lot: last year's history is one of your best restocking plans for this year. Looking at the same week in 2025 and comparing it to 2026 tells you whether the spike is arriving earlier, later, stronger, or weaker.
If sales of a product rose more than 30% compared with the average of the previous four weeks, that is already a clear signal: the spike has started. Get ahead of restocking instead of reacting in panic afterward.
Hidden seasonality: the customer who comes back every month
There is a kind of acceleration that never shows up on the calendar: the repeat customer.
Think about Mary: every month for the past year, she has bought the same product from your store. You know that from memory. But if Mary does not show up one month, will you notice? Will you remember to send her a message? Will you understand that you just lost a customer worth 12 sales a year?
That hidden seasonality lives in each customer's history. Whoever records who bought what can actually see those repeat patterns. Whoever relies only on memory misses those opportunities without noticing. And by the time they notice, the opportunity is already gone.
How history shows you the spike before the stockout
The rule is simple. Look at your product sales history and make two comparisons:
- The same period last year: if today is the first week of October, look at the first week of October last year. If sales accelerated, move earlier.
- The average of the last 4 weeks: if this week's sales are 30% above that average, there is an acceleration already underway.
You do not need a sophisticated tool. You need history. And if you do not have it, a good system stores it and shows you the item directly on screen.
Signal 3: Where your money is tied up
The third signal is the most strategic one. It is the one that helps you decide what not to restock, and where your profit is getting stuck without you noticing.
That signal has a name: ABC analysis. The idea is simple. In any store, a small share of products is responsible for most of the revenue.
What is ABC analysis?
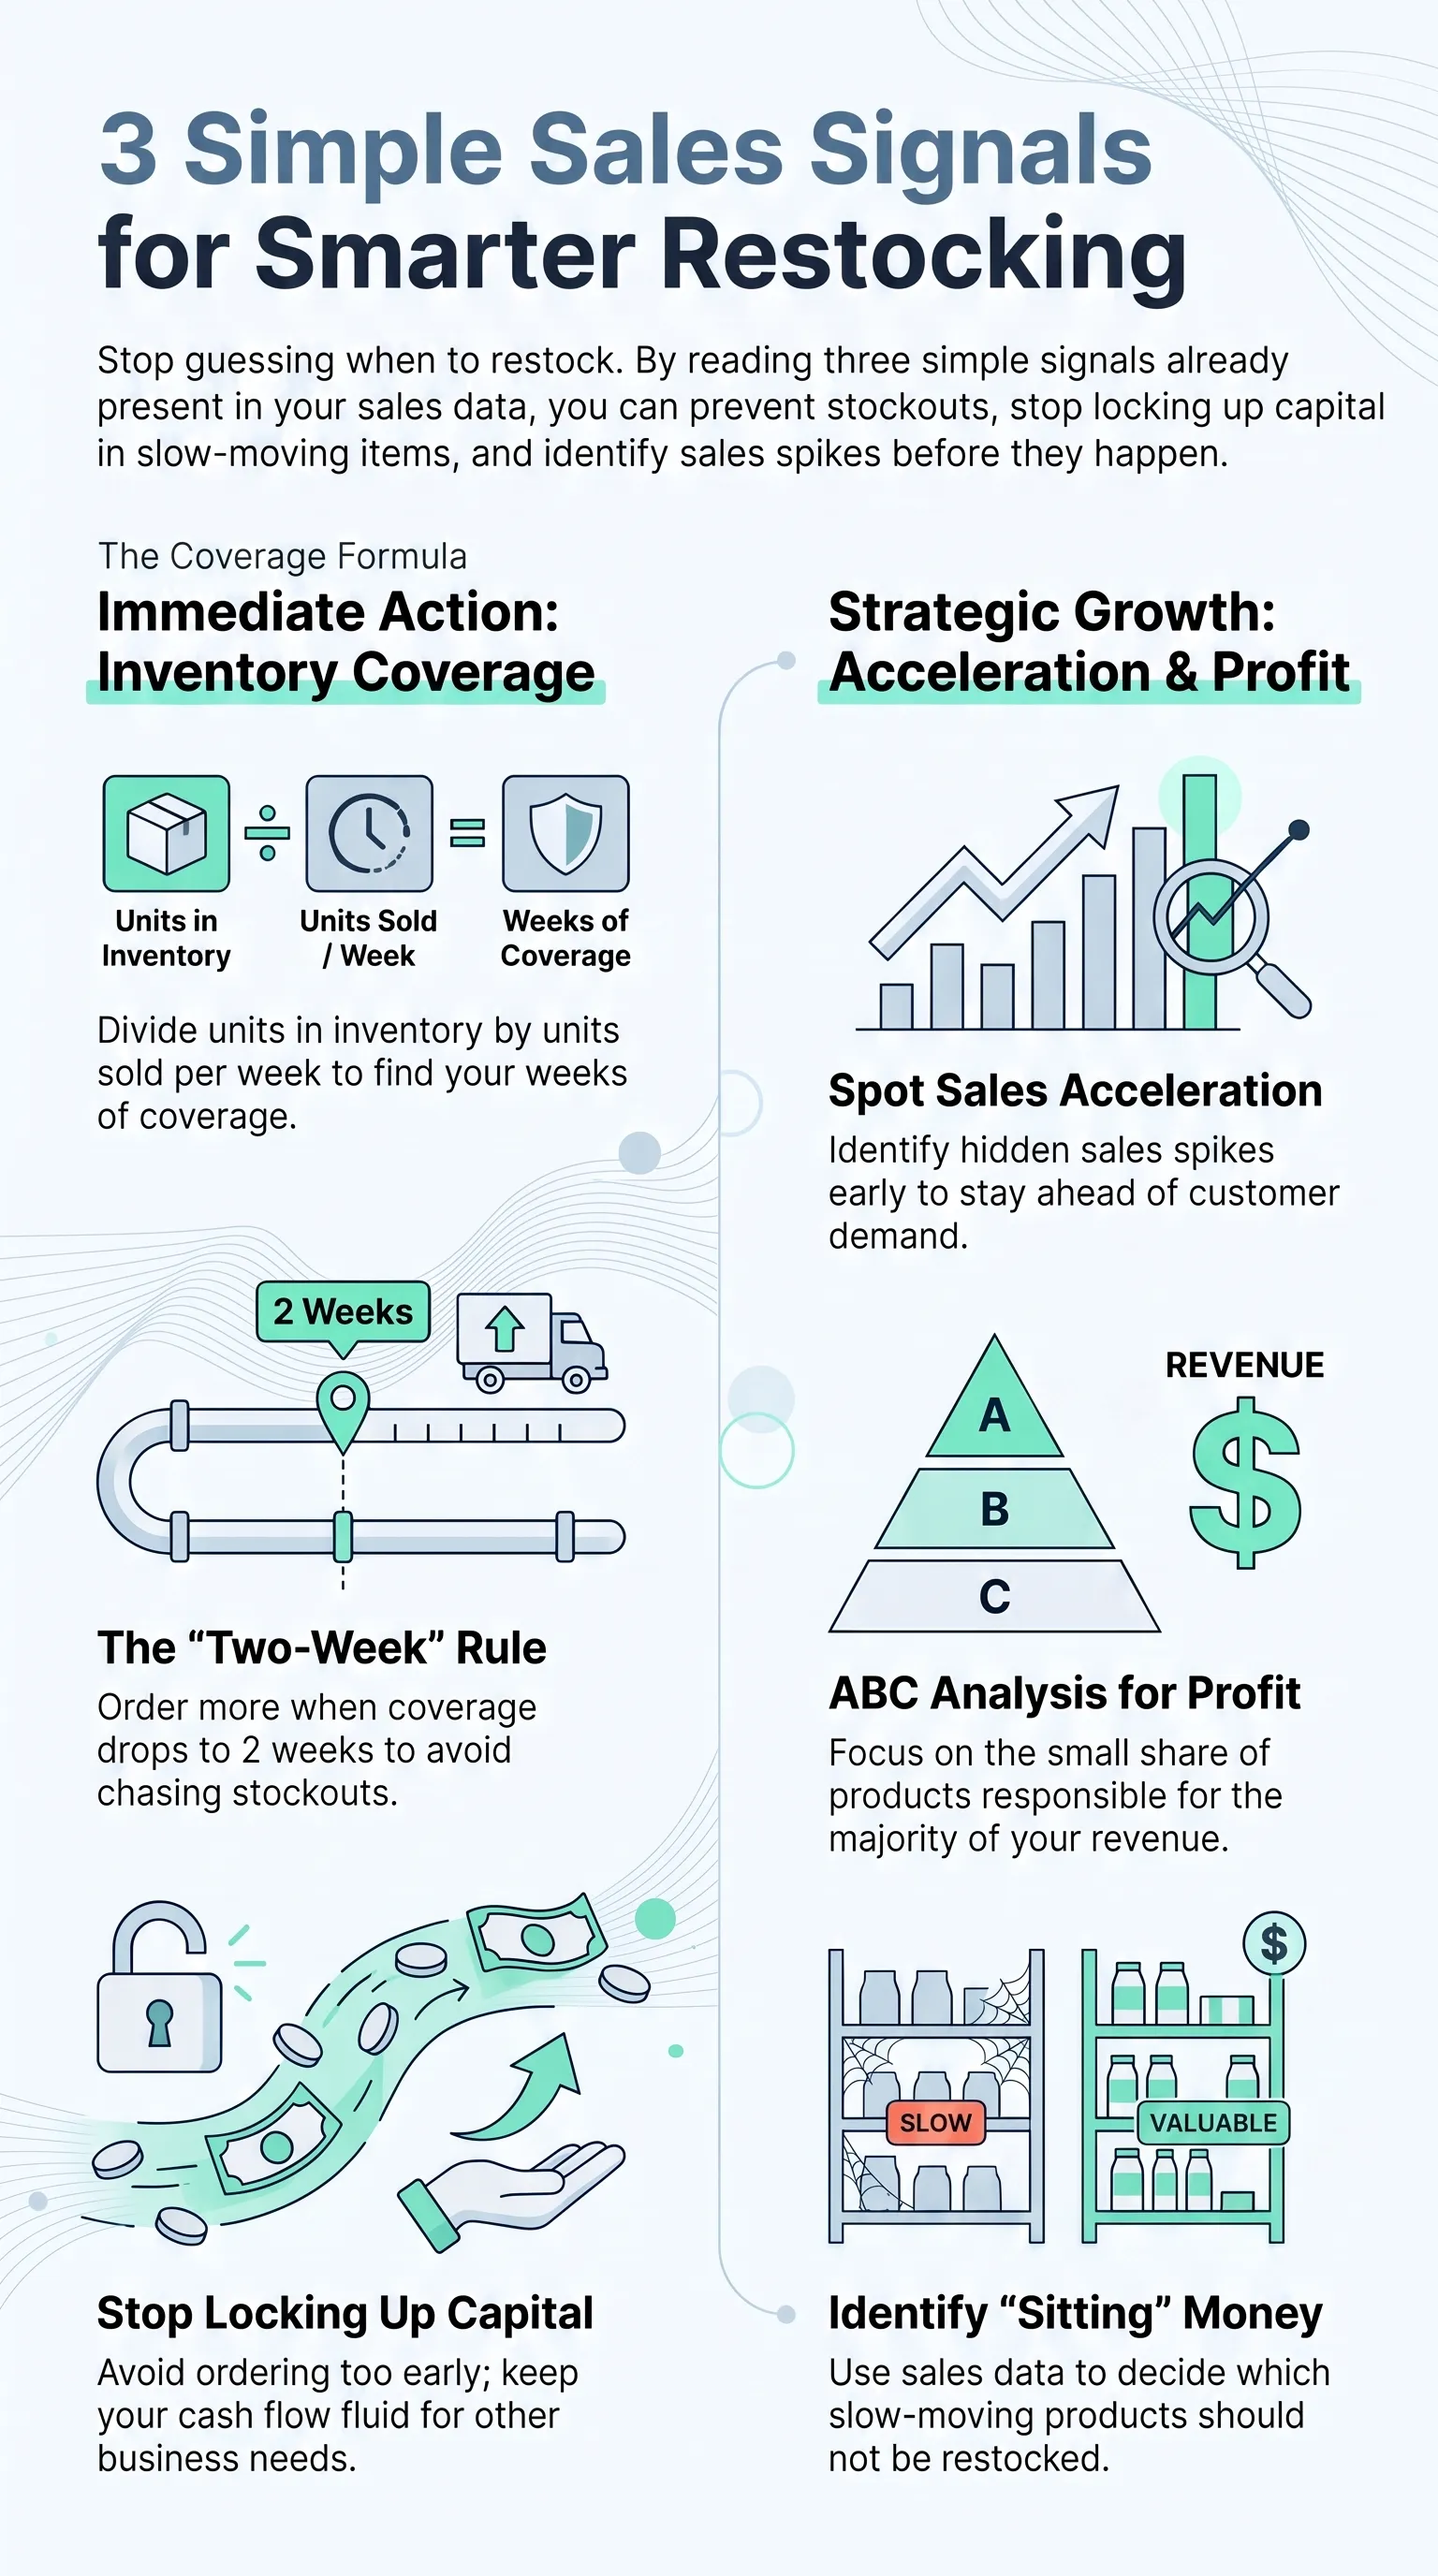
The logic comes from the Pareto principle, the idea that 20% of causes create 80% of outcomes. Applied to sales, it works like this: ABC analysis separates your mix into three groups based on how important they are to the operation.
- A items, the winners. About 20% of your products generate 80% of your revenue. These are the products that can never be missing.
- B items, the middle of the mix. About 30% of your products generate 15% of revenue. They sell consistently and deserve attention.
- C items, the rest. The other 50% of products generate only 5% of revenue. They sell slowly, take up space, and tie up capital.
How to classify products without a spreadsheet
You do not need software to start. Take the 30 products that sold the most last month: that is your A item. Take the next 60: that is your B item. Everything else is your C item.
If your store has 200 products in the catalog and 180 of them sold fewer than 5 units that month, those 180 are your C item. They take up space, tie up capital, and compete for attention with your best sellers.
How the curve changes your restocking decision
ABC analysis changes everything. Here is how to treat each group:
- A items: restock first, check weekly. These products cannot be allowed to run out. If coverage drops below 2 weeks, that becomes top priority.
- B items: restock monthly, check whether they are accelerating. Treat them with regular attention. If a B item starts picking up speed, it may be turning into an A item.
- C items: stop restocking, run a promotion, clear space. This is where most store owners get stuck. The instinct is to keep buying the same item because "it still sells a little." But selling a little of something that takes up space and traps capital costs more than it brings in.
Deciding what not to restock is just as important as deciding what to restock. This is where your cash flow starts breathing again.
How to read the 3 signals
You can apply these three signals manually in 15 minutes a week. All you need is a simple table:

That table fits on a single page and solves 80% of the restocking decision.
Nicole's turning point
Nicole runs a cosmetics store. She has been selling for six years, serves customers through WhatsApp, has a loyal customer base, and brings in around $20,000 a month.
For a long time, Nicole made restocking decisions by looking at the shelf. "If it runs out, I order more. If there is too much left, I stop ordering." That worked for a while. But as business picked up, two things started happening.
The first was stockouts. Every week there was some product she no longer had. The customer asked for it, she checked the counter, and the sale went to the competing store across the street.
The second was trapped cash. She had three boxes of products that had not sold for months. She did not know how they had ended up there, but they were taking up shelf space and tying up capital.
One Monday, she sat down to fill out the three-signal table. She calculated coverage, looked at history, and separated best sellers from the rest. In about an hour, she saw things that had been right there for years without her noticing.
The first thing she found was that two A-item products had only 1 week of coverage left. She ordered more on Monday, they arrived on Friday, and she did not run out over the weekend.
The second finding was that eight C-item products had been sitting for more than 90 days. She ran a flash promotion on WhatsApp and sold six of them in three days. She freed up space and capital.
The third finding was that one product she thought was weak was actually selling every month to the same four customers. When she saw that clearly, she sent each one a direct message. Three replied the same day.
In 90 days, Nicole cut stockouts in half and stopped restocking what was not moving. She did not become an analyst. She just started reading what the store had already been telling her.

Conclusion
Your store already has the data. Every week it tells you what is selling, what is accelerating, and where your money is standing still. The three signals — days of inventory, demand spikes, and ABC analysis — are there for you to read instead of guess.
Restocking by gut feel is the most expensive way to run a store. Stockouts cost customers. Dead inventory costs cash. Both disappear the same way: in sales that never happened and capital that never came back.
You do not need to become an analyst. You need 15 minutes a week and three simple questions.
Frequently asked questions
How do I know whether I should restock or wait?
Look at days of inventory. If coverage is above 4 weeks, wait. Between 2 and 4, prepare the order. Below 2, restock now. If the product is in item A and coverage is falling fast, restock even with 3 weeks left. Do not wait for the stockout.
What is the difference between inventory turnover and days of inventory?
Turnover measures how many times inventory was renewed over a period, usually months or a year. It is a long-term indicator and helps show whether a product sells well over time. Coverage measures how many weeks your current inventory will last at the current sales speed. It is a short-term indicator and is more useful for deciding whether to restock right now. For day-to-day decisions, coverage is usually more useful. For mix strategy, turnover helps more.
Do I need a spreadsheet to do this?
No. You can do it by hand with a simple table: product, weekly sales, current inventory, and coverage in weeks. It takes about 15 minutes a week.
What if my operation is small? Do these signals still work?
Yes. In smaller operations, these signals protect cash flow even more, because every lost sale and every slow-moving product carries more weight. With 30 products in the catalog and 10 sales a week, you can do this reading in 10 minutes. That is exactly the size where inventory and sales control make the biggest difference.